
Why 85+ is the New 75+ for Senior Housing Demographic Analysis
November 25, 2019
Highlights: The Difference Between 75-84 and 85+ Demographic Cohorts
- In a dynamic senior housing landscape, it’s critical to track and analyze accurate demand-growth data to identify top MSAs (or “markets”) across the country in terms in population and income.
- The rising age of entry into senior housing in conjunction with an increasingly diverse array of housing options and services available to an equally diverse resident base may be signaling that it’s time to look beyond the traditional 75+ age cohort and take a more granular approach when measuring demand.
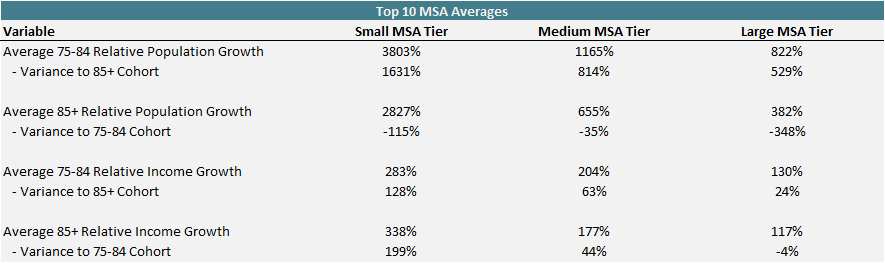
- Top markets in the small MSA tier – on average – have the strongest projected population and income growth (expressed as a %), followed by the medium MSA tier, while the large MSA tier has the weakest growth projections.
- Population and income growth between the 75-84 and 85+ age cohorts can vary significantly at the market level in all three MSA tiers. The top markets in the small MSA tier – on average – have the largest variance of population and income growth between the two age cohorts, followed by the medium MSA tier, while the large MSA tier generally shows the smallest variance between the age cohorts.
Measuring Demand in a Dynamic Landscape
As the senior housing landscape continues to expand and change at a rapid pace, identifying and capturing demand remains a top priority for investors, operators, developers, and other industry stakeholders. As such, it’s critical to track and analyze accurate demand-growth data to identify top markets across the country in terms in population and income.
Variables such as population growth and income growth of the 75+ age cohort are often analyzed by industry participants to gauge senior housing demand. However, the average age of residents in senior housing is believed to be presently in the mid-80s. According to NIC, the age of entry for new independent living residents has risen from early 80s to the mid-80s, with the typical new resident being an 83-year-old widowed female. The age of entry for new residents in assisted living has risen to the higher range within the mid-80s, with the typical new resident being an 84-year-old widowed female. The increasing age of entry is an important trend to note, as it’s one factor signaling that it may be time to move beyond measuring demand by analyzing the industry-standard 75+ age cohort.
Furthermore – in a diverse senior housing landscape with various property types and services, it’s logical to assume that the resident base across the industry is also diverse and dynamic and can vary depending on facility type and services offered. As such, analyzing the 75+ age cohort as a catch-all for age-qualified seniors may result in a distorted measurement of demand depending on where the product offering falls on the senior housing continuum. For example, if the housing product falls closer to the beginning of the continuum (i.e. independent living or similar) and appeals to a younger resident, it may be prudent to place more weight on the population and income growth of the 75-84 age cohort than the 85+ cohort. If the housing product falls closer to the middle/end of the continuum (i.e. assisted living or similar) and appeals to a slightly older resident, it may be reasonable to place more weight on the population and income growth of the 85+ age cohort than the 75-84 age cohort.
Fastest Growing MSAs in Terms of Population and Income
VisionLTC conducted research to uncover the top MSAs (or “markets”) across the country for population growth and income growth. To move beyond the traditional age 75+ dataset, two separate and more distinct age cohorts were analyzed: age 75-84 and age 85+. Using its analytics platform, VisionLTC ran a nationwide analysis to identify the Metropolitan Statistical Areas (MSAs) with the highest population and income growth for each of the two age cohorts over the next 5 years (2020 – 2025). The MSAs are broken down into three tiers:
- Small MSAs (total population of 10K – 100K)
- Medium MSAs (total population of 100K – 1M)
- Large MSAs (total population of 1M+)
The population and income growth rates for each individual market displayed in the tables below are relative to the average population growth and income growth of the entire MSA tier that the individual market falls within. For example, the 85+ relative population growth of the Breckenridge, CO MSA = the 5-year 85+ population growth rate of the Breckenridge, CO MSA divided by the 5-year average growth rate of the entire population of the 535 markets that comprise the small MSA tier.
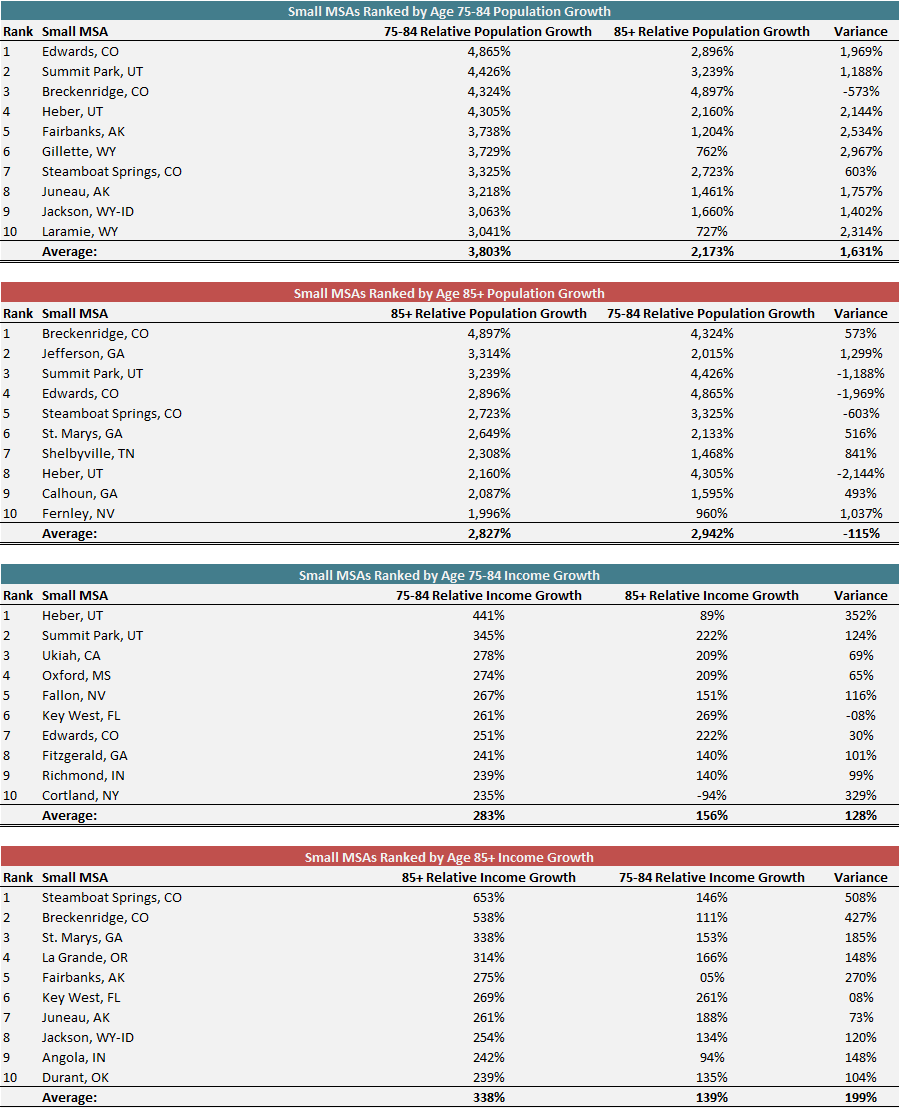
Fastest Growing "Small" MSAs
The small MSA tier contains a total of 535 markets across the country. The top 10 fastest growing small markets by age cohort in terms of population and income are displayed in the tables below.
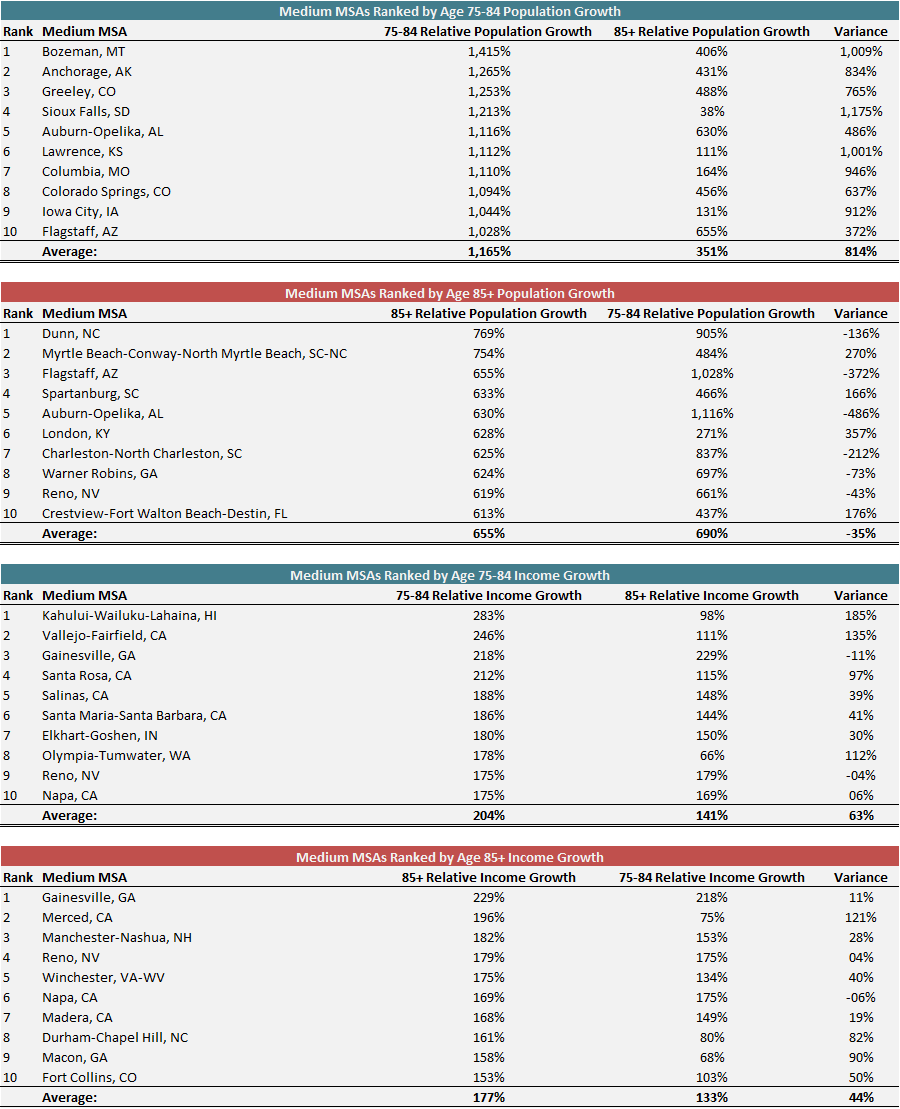
Fastest Growing "Medium" MSAs
The medium MSA tier contains a total of 327 markets across the country. The top 10 fastest growing medium markets by age cohort in terms of population and income are displayed in the tables below.
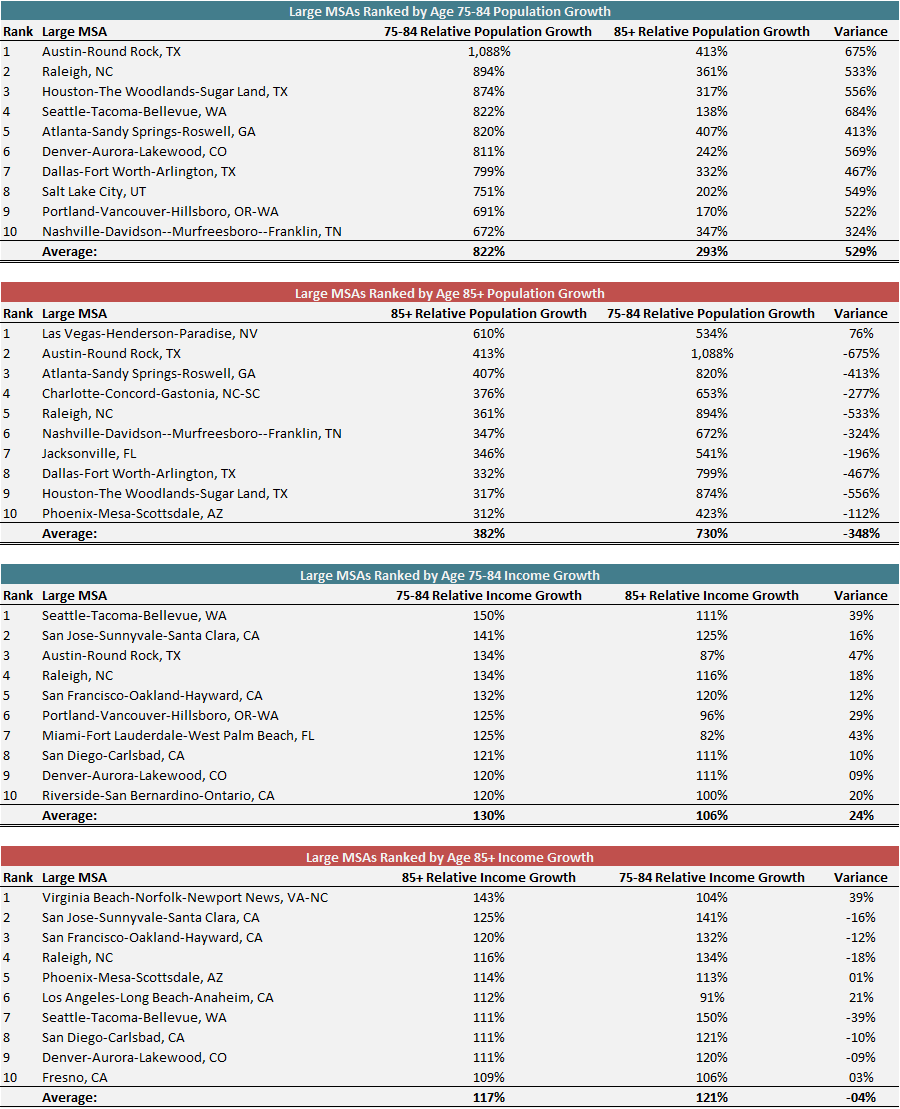
Fastest Growing "Large" MSAs
The large MSA tier contains a total of 55 markets across the country. The top 10 fastest growing large markets by age cohort in terms of population and income are displayed in the tables below.
Takeaways
The results of the VisionLTC analysis provide some interesting insight. Out of the three MSA tiers, the top 10 markets in the small MSA tier – on average – have the strongest projected population and income growth, followed by the top 10 markets in medium MSA tier, while the top 10 markets in the large MSA tier have the weakest growth projections. Furthermore, it’s evident that population and income growth between the 75-84 and 85+ age cohorts can vary significantly at the market level in all three MSA tiers. The top 10 markets in the small MSA tier – on average – have the largest variance of population and income growth between the two age cohorts, followed by the top 10 markets in the medium MSA tier, while the top 10 markets in the large MSA tier generally show the smallest variance between the age cohorts.
It’s critical to track and analyze accurate demand-growth data to identify high-potential markets and capture unmet demand. Coupled with the rising age of entry into senior housing, and the myriad of property types and services being offered, it may be time to move beyond the age 75+ dataset to instead take a more granular approach to analyzing demographics.
Consider utilizing the 75-84 and 85+ age cohorts independently, when possible, to provide more granular details in your analysis. You may uncover significant differences in the population size, expected growth rates, and income/wealth levels of these cohorts that were once thought to be identical.
Note: all of the data used in this post was created with the VisionLTC Market Insight platform.
NIC MAP Vision gives operators, lenders, investors, developers, and owners unparalleled market data for the seniors housing and care sector.