
Resident Origin & Migration Trends in Senior Housing – Where Do Your Residents Come From?
December 2, 2019
Understanding resident origin and migration trends is important for lenders, operators, developers, and other parties involved in the business of senior housing. It is also necessary to be aware of how resident migration trends change when comparing independent living versus assisted living properties and how to incorporate these differences in your market research and your sales practices.
At VisionLTC, we understand the importance of this data, and we can give you a detailed view into senior housing resident migration trends at the nationwide level, and more importantly, the market level.

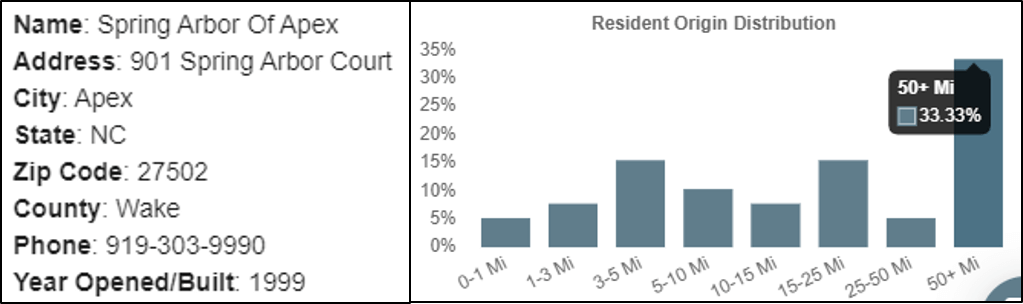
This map shows you the migration patterns of residents at Spring Arbor of Apex in Apex, NC. The green and yellow dots represent where its residents lived before moving into the property.
The bar chart below shows you the distribution for resident relocation distance, in this case, 33% of Spring Arbor’s residents moved greater than 50 miles to live in this community.
We have this data available for more than 15,900 senior housing communities across the US and have conducted an analysis to see how migration trends differ between assisted living (AL) communities and independent living (IL) communities.
Nationwide Senior Housing Resident Origin Trends
Focusing on nationwide trends, we found that seniors who chose assisted living properties preferred one that was in-market (a property less than 50 miles from their home).
Out of the 12,219 assisted living (AL) communities where data is available, 75.69% of seniors chose communities less than 50 miles from their homes, while the remaining 24.31% of seniors chose communities more than 50 miles from their homes (out of market).
Regarding independent living (IL) properties, 70.26% of seniors chose communities within 50 miles of their homes and 29.74% of seniors chose communities over 50 miles from their homes.

On the national level, the overall migration trends between assisted living and independent living communities are similar, but as you can see in the table above there are subtle nuances between the relocation distance tiers (i.e. Seniors who relocated <1 Miles and 15-25 Miles).
Metropolitan Statistical Area Senior Housing Resident Origin Trends
At metropolitan area (MSA) level, trends vary more greatly when compared to the US overall, and these differences are important to your market research.
The following is based on MSAs were data for assisted living and independent living communities is available.
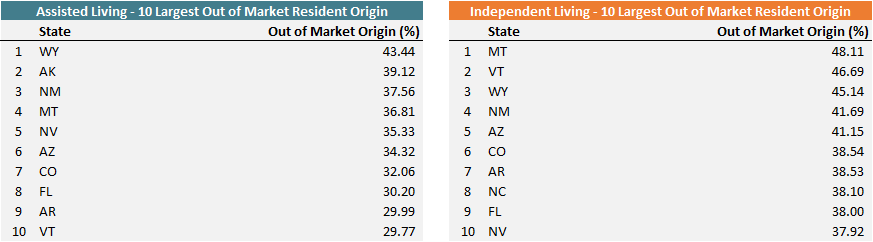
In terms of assisted living, the MSAs with the largest out-of-market resident origin (meaning seniors moved more than 50 miles to live in the community) are:
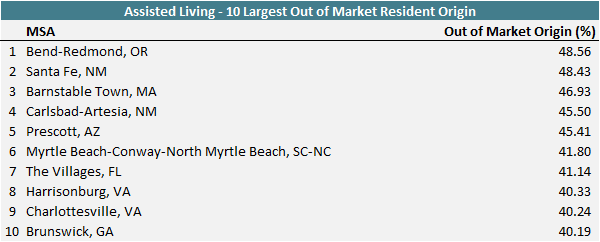
For independent living, the list is as follows:
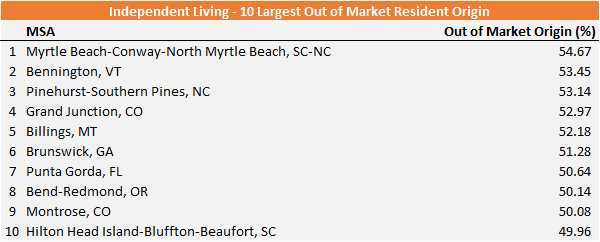
Interesting to note that Bend-Redmond, OR is first for assisted living and eighth for independent living, and Myrtle Beach is sixth in terms of largest out-of-market origin in assisted living and first for independent living.
All of these MSAs show stronger out-of-market appeal relative to nationwide-level trends for both assisted living and independent living.
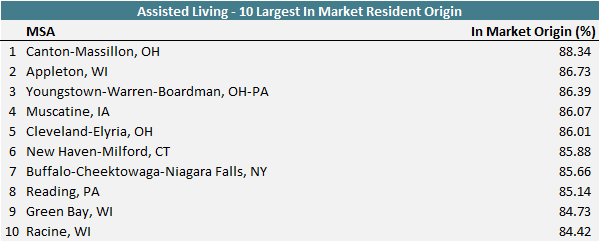
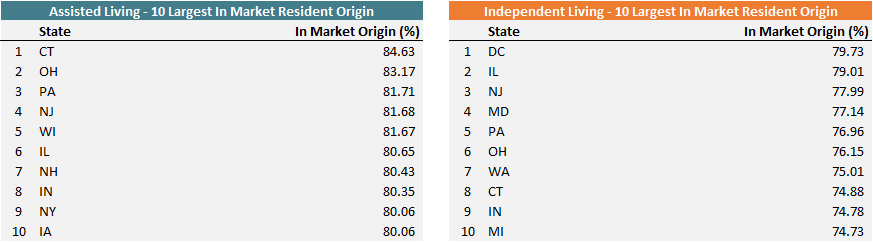
On the other hand, the MSAs with the highest in-market resident origin (meaning the senior lived within 50 miles of the community) for assisted living communities are:
The list for independent living origin is:
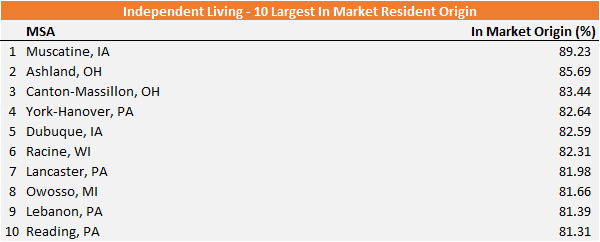
Muscatine, IA, Canton-Massillon, OH, Reading, PA, and Racine, WI are on the top 10 list for both assisted living and independent living in-market origin statistics.
Comparing the “Top 10” out-of-market MSA list versus in-market MSAs, we see that there are only subtle differences between AL and IL, while there are extreme differences between MSAs.
For example, 88.34% of Canton-Massillon, OH, assisted living community residents come from in-market, while only about 51.44% of Bend-Redmond, OR, assisted living community residents come from in-market.
Similarly, 89.23% of Muscatine, IA independent living residents come from in-market while only about 45.33% of Myrtle Beach-area independent living residents come from in-market.
State Senior Housing Resident Origin Trends
Lastly, let’s analyze the state-level origin trends between IL and AL communities. Connecticut, Ohio, and Pennsylvania have the largest in-market resident origin for assisted living communities, while Washington, D.C., Illinois, and New Jersey have the highest in-market resident origin for independent living communities.
As for out-of-market communities, Wyoming, Arkansas, and New Mexico have the highest origin for assisted living. Montana, Vermont, and Wyoming have the highest for independent living communities.
Similar to what we saw in the MSA-level data, the variance between AL and IL in the same region (in this case the State) is subtle, but the variance between States can be significant.
Learning More about Senior Housing Resident Migration Trends
These trends and origin data can be used to support your market research in many ways, including:
- Define your primary market areas by analyzing existing supply’s origin patterns
- Improve marketing/sales outreach by identifying resident origin “hot spots”
- Assess what communities in your market compete with your communities’ draw area
Using this research, you can see how states and MSAs have varying trends between in-market and out-of-market resident migration. Generally, though the nationwide senior housing migration trends are very similar when it comes to both types of housing.
Our goal at VisionLTC is to give you clear, comprehensible data to help you understand the senior housing market and make decisions efficiently.
NIC MAP Vision gives operators, lenders, investors, developers, and owners unparalleled market data for the seniors housing and care sector.