Insights on Seniors Housing Key Indicators
NIC MAP Senior Housing Market Fundamentals are compiled from the current quarter NIC MAP data release that includes data from more than 15,000 seniors housing and care properties in 140 metro markets across the United States. NIC MAP Seniors Housing Market Fundamentals Data Report includes:
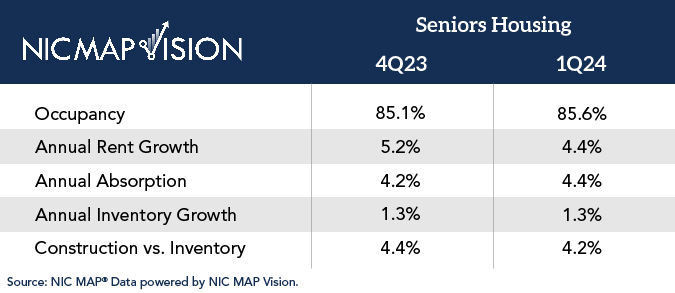
- Key findings in senior housing market data
- Senior housing and care occupancy rates
- Annual rent growth for senior living residents
- Annual absorption
- Annual inventory growth
- Senior living and active adult community construction vs. inventory
- Rolling 4-quarter starts vs. inventory
NIC MAP Vision clients with access to NIC MAP data may now access this timely new data for the senior housing and care market, which includes three-month rolling data reported on a monthly basis. Data includes stabilized occupancy, all occupancy and inventory at the metro level. To give you some insight, NIC MAP Vision is pleased to offer you an up-to-date Market Fundamentals Data Report for complimentary download.
Join Us for a Closer Look at the Data
Clients with access to NIC MAP data also receive an exclusive invitation to a market fundamentals webinar led by industry experts. The webinar, hosted by NIC MAP Vision the week after each market fundamentals data release, gives attendees a deeper analysis of notable senior housing trends from that quarter.
You’ll hear helpful insights from industry experts such as NIC’s Senior Principal, Caroline Clapp, who explains each quarter’s trends in context with historical data and current events.
To get a better idea of what’s covered, watch an abridged version of our webinar.
Market Fundamentals 1Q24 – Seniors Housing -Released April 4, 2024