
How Do Regulations Affect COVID-19 Infection Rates in Assisted Living?
June 23, 2020
VisionLTC has analyzed the spread of COVID-19 in Assisted Living communities in the US, using a mix of data from sources that include the Centers for Medicare & Medicaid Services (CMS), state and local agencies (i.e. NC Department of Health and Human Services), news publications, and self-reported cases directly from communities.
Here are a few high-level takeaways that we think you’ll find interesting…
var divElement = document.getElementById(‘viz1591902150370’); var vizElement = divElement.getElementsByTagName(‘object’)[0]; vizElement.style.width=’100%’;vizElement.style.height=(divElement.offsetWidth*0.75)+’px’; var scriptElement = document.createElement(‘script’); scriptElement.src = ‘https://public.tableau.com/javascripts/api/viz_v1.js’; vizElement.parentNode.insertBefore(scriptElement, vizElement);
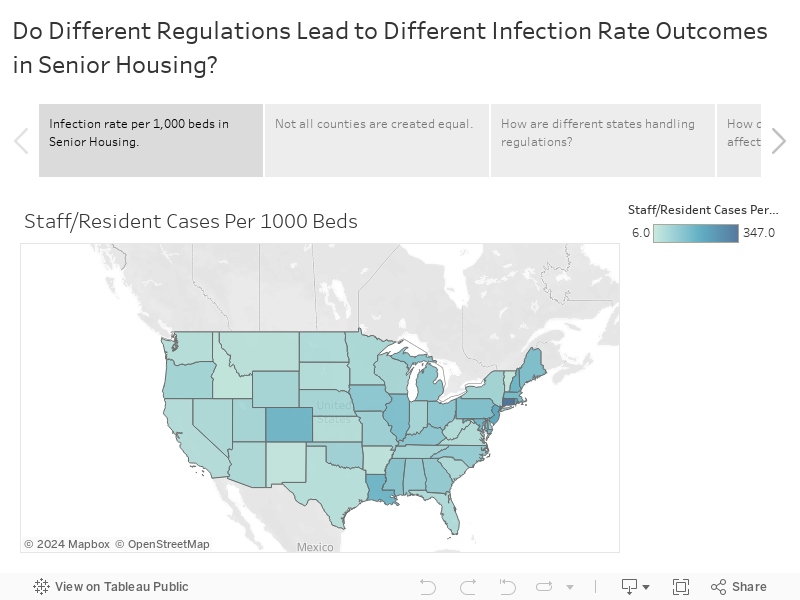
Infection rate per 1,000 beds in Senior Housing
The infection rate of COVID-19 varies greatly from state to state – it also varies amongst senior housing communities. To put each state on “equal terms,” we analyzed the data based on the number of COVID-19 infections in Assisted Living communities per 1,000 Assisted Living beds for each state.
The map below is interactive, and you can see that the infection rate varies at the state level from as low as 6 infections/1,000 ALF beds (Hawaii) to as high as 347 infections /1,000 ALF beds (Connecticut). Click or hover on each state to see that state’s ALF infection rate.
Not all counties are created equal
While State-level data is interesting, it doesn’t always provide you with insightful takeaways that can be beneficial to your business planning efforts. This next interactive graphic showcases the same COVID-19 infections in Assisted Living communities per 1,000 Assisted Living beds measure, but at the county-level.
Note that you can use the drop down in the top-right hand corner of the map to change which state you’re analyzing. Counties that have no known infections are excluded from this analysis and are grayed-out.
In North Carolina, you can see that the infections/beds range from 3/1,000 (Rowan, NC) to 1,125/1,000 (Northampton County). The infection numbers include both staff members and residents, and the data shows that serious outbreaks can occur even when the state has the appearance of a “modest” outbreak. North Carolina’s state-level infection rate is 91/1,000.
How Are Different States Handling Regulations?
CMS identified three key protective measures that states should consider enforcing to protect their Assisted Living communities, including:
- Visitation
- Screening
- Usage of PPE
Each state is handling COVID-19 response differently and we’ve gathered some information on the precautions that each state is taking, or not, as of June 1, 2020 as it pertains to Assisted Living communities. This table, “How are different states handling regulations,” showcases the variance in response by locality.
How Do Screening Requirements Affect the Infection Rate?
We’ll compare state’s Assisted Living infections per 1,000 beds (“infection rate”) against their requirements on daily staff screening measures.
Regarding daily staff screening measures, states have issued one of the following three decisions: Require, Recommend, or No Guidance, and the chart shows that both guidance and infection rate varies significantly across states.
Fifteen states require daily screening of staff, twenty-five states recommend daily screening of staff, and eleven states issued no guidance.
How Do PPE Requirements Affect the Infection Rate?
This next chart compares the state-issued guidance for Assisted Living communities pertaining to staff use of personal protective equipment (PPE) against the state infection rate.
Regarding staff use of PPE in Assisted Living communities, states have issued one of the following three decisions: Require, Recommend, or No Guidance, and the chart shows that both guidance and infection rate varies significantly across states.
Ten states require staff use of PPE, twenty-four states recommend staff use of PPE, and seventeen states issued no guidance.
How Do Visitation Limits Affect the Infection Rate?
Now we’ll compare each state’s infection rate against the state-issued guidance for Assisted Living communities pertaining to visitation measures.
States have issued one of the following four decisions, as it relates to visitation restrictions in Assisted Living communities: Prohibit, Recommend Prohibit, Restrict, or No Guidance, and the chart shows that both guidance and infection rate varies significantly across states.
Twenty-five states prohibit visitors, seventeen states recommend prohibiting visitors, three states restrict visitors, and six states issued no guidance.
Do Different Regulations Lead to Different Infection Rate Outcomes in Senior Housing?
Based on our data, States that offered “No Guidance” to Assisted Living communities on screening requirements for staff experienced an average infection rate of 147/1,000 beds. States that “Recommended” screening to Assisted Living communities exhibited 30% less cases, on average, with an infection rate of 102/1,000 beds. Assisted Living communities in States that “Required” screening for staff members, experienced 42.86% fewer infections per 1,000 beds with an average infection rate of 84/1,000.
In this case, it seems that states that “Recommend” or “Require” communities to operate with an abundance of caution has led to a lower infection rate than operating with “No Guidance”.
NIC MAP Vision gives operators, lenders, investors, developers, and owners unparalleled market data for the seniors housing and care sector.