
A Way to Pay: The Importance of the Housing Market in Senior Housing
August 28, 2017
Examining trends in median home values is a key factor when assessing whether, and to what extent, seniors will be able to pay for senior housing. We know the cost of care and housing is expensive, costing between $3,000 and $4,500 a month; seniors typically pay for it in one of two ways:
- Income– Seniors who have income from pensions, public benefits, or rents, or who have family members who work and support them, can use their income to pay for their long-term care.
- Assets– Seniors who own stocks, bonds, cars, or real estate can sell their assets and spend down the money that they earn.
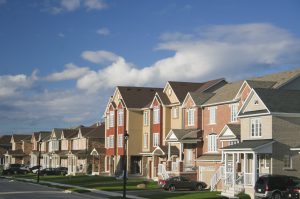 Of all the investments that the typical senior owns, few are larger or more significant than their home. While most people who buy a house are simply looking for a secure place to live, home ownership also gives them access to a valuable asset, which can help them out of difficult financial situations when they arise. In particular, seniors may have an easier time coordinating senior housing and care for themselves, if they have homes they can sell or rent to pay for their care.
Paying attention to median home values in your market area can help you assess the average homeowner’s ability to pay for care. It’s also helpful to understand how home values have changed over time and how they’re expected to change in the future when assessing a market’s attractiveness for new senior housing projects.
Let’s take a moment and look at past trends and future expectations in the housing market.
Changes in Median Home Value during The Great Recession (2008-12)
Lasting from 2008 to 2012, the Great Recession brought with it a collapse of home prices. In most housing markets, that change was a steep decline; median home values went down by as much as 60 percent in the space of only 4 years. Other markets, however, were spared and some even expanded, growing by as much as 20 percent during the same period. When home prices are declining, seniors may experience financial difficulty and have a tougher time affording the cost of care.
Changes in Median Home Values since 2012
As important as the Great Recession’s impact was, the housing market has hardly stood still since then. By studying home value data over the past 5 years and comparing it to that from the depths of the recession, we can answer two key questions:
1. Has the Housing Market Grown, Lost Value, or Stagnated?
The good news is that, on average, the housing market has demonstrated clear, and relatively robust growth, and has largely recovered from the effects of the Great Recession. In January of 2012, the median price of a house in the United States as a whole was $221,700; by January of 2017, this had risen to $317,400. While home values do not always increase from month to month, the overall trend has been strongly positive.
It’s important to note, that not all markets have grown since the recession as some markets did continue to decline, but the majority expanded. You can see in the first image below, all the markets that experienced a declining in home values from 2012 to 2017. The second image shows you all the markets that experienced an increase in home values during the same time.
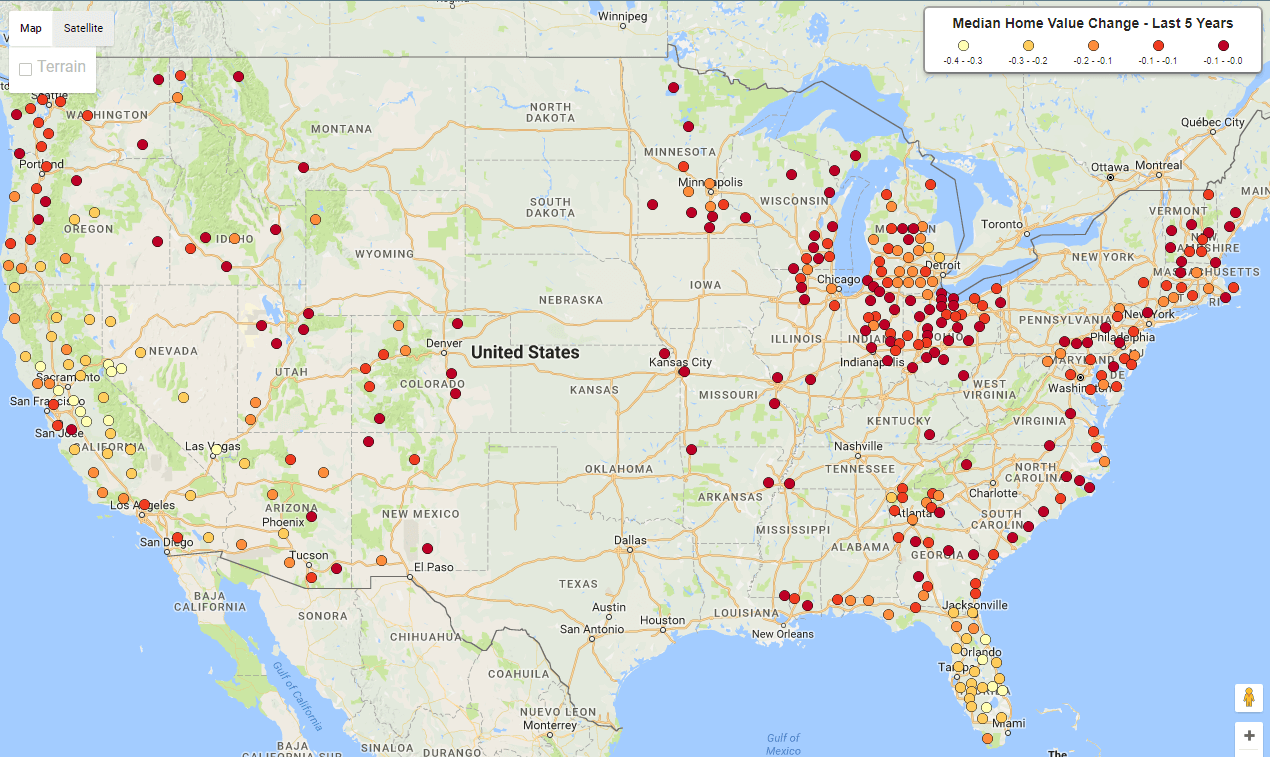
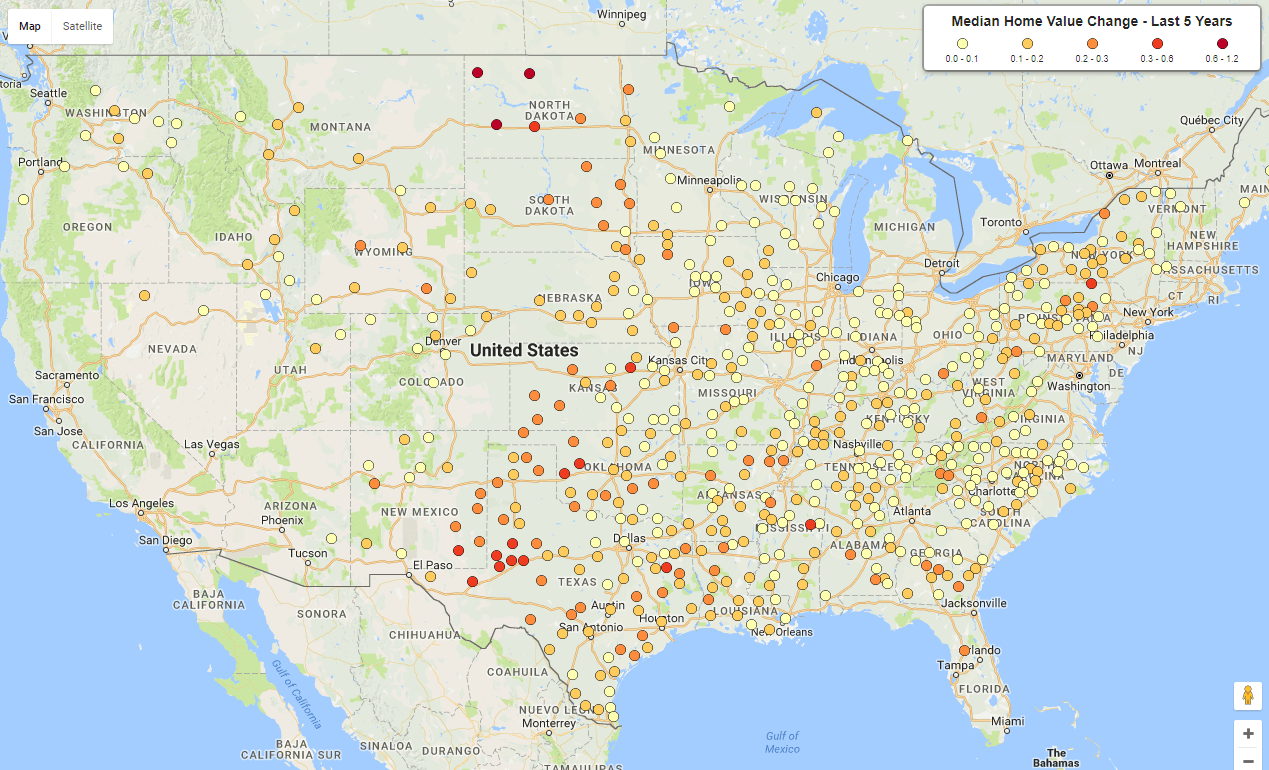
It’s important to pay attention to home values in your primary market area if you want to determine the financial capabilities of prospective residents. You can see from the maps above that housing markets changed with significant variety across the US, even though on average, home prices increased.
2. How Much Has the Market Changed?
Besides noting that the housing market has grown since 2012, it’s also important to compare the size of that growth to the size of the market’s contraction during the Great Recession. Here, too, the news is largely positive. Prior to the recession, median home values reached their height in March of 2007, at $262,600. At their lowest point in October of 2010, they dropped to $204,200. The fact that home values are now above $300,000 suggests that the housing market has more than made up for the Great Recession’s effects.
Projected 5-Year Growth in Median Home Values
Beyond examining past and current developments in housing values, it is also important to pay attention to future projections. Investigating the expected growth rate in median home values for your market area allows you to determine how much and how quickly seniors’ property will appreciate.
Projected increases in home value provide perspective on how much wealth seniors will have over the long haul. The higher and more consistent the local rate of growth is, the more wealth seniors will have and the greater their ability will be to pay for costly services.
Because most seniors who are in senior housing do not receive enough income to cover the full cost of their care, the current and projected value of their homes is critical to their ability to pay. The higher median home values are and the faster they grow, the easier it will be for seniors to afford to stay in senior housing.
NIC MAP Vision gives operators, lenders, investors, developers, and owners unparalleled market data for the seniors housing and care sector.